Fat Loss and GLP-1
A client sends two InBody printouts a week apart. The second says he gained 1.2 kg of fat and lost 0.8 kg of muscle. He has been in a deficit, sleeping well and lifting hard. He wants to change everything.
What actually happened is that he tested the first one after a rest day with a full breakfast and the second one after a leg session on an empty stomach. The machine measured his hydration and called it fat.
This happens every week, and the fix is knowing what each method can and cannot see.
Every body fat method is an estimate built on assumptions. The research reference is a four-compartment model that measures body density, total water and bone mineral separately, and almost nobody outside a lab has access to it. Everything else, DEXA included, is compared against that and comes with an error range.
So the question is never "what is my exact body fat?" It is "which method is consistent enough to show a real change, and how do I use it so that it does?"
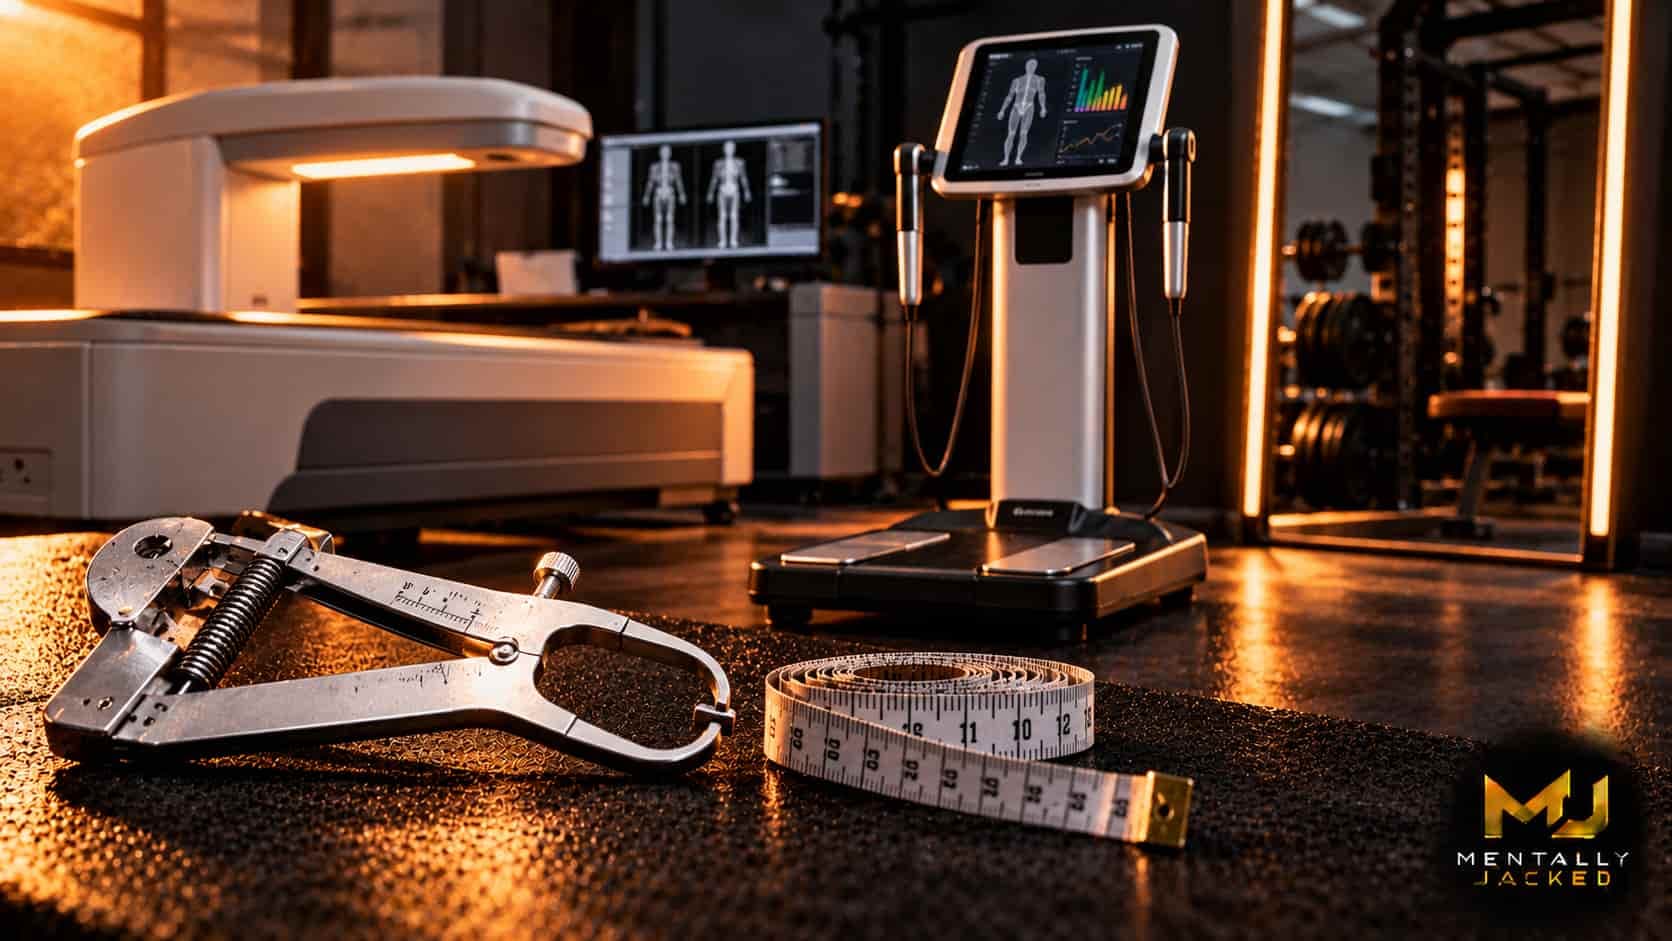
Dual-energy X-ray absorptiometry passes two X-ray beams through the body and separates bone, lean tissue and fat. It gives regional data, so you can see whether fat is coming off the trunk or the legs, and it measures bone density as a bonus. Radiation is a fraction of a chest X-ray.
Its weaknesses are the ones people forget. Hydration and glycogen change the lean reading, so a scan after a carb-heavy weekend reads more muscle than one after a depleted week. Different machines and software give different numbers, so use the same centre every time. And it still carries an error of a couple of points, which means a change of one point between scans is noise.
BIA devices send a small current through the body and infer fat from how much resistance it meets. Water conducts well, fat does not. That is the whole method, and it is why the reading changes with hydration, meal timing, training, sodium, alcohol and time of day.
Used casually, BIA is the least reliable method on the list. Used under strict conditions it becomes useful for trends:
Even then, treat a single reading as meaningless and a six-week trend as information. A result that says you lost muscle after a week in a deficit is telling you about glycogen and water, not muscle.
A trained tester pinches the skin and fat at several sites and reads the thickness. The equations that convert the sum to a percentage are population-specific and add error, but the raw sum of skinfolds is a clean number to track.
The key is the tester, not the tool. The same person, measuring the same sites the same way each month, produces useful data. A different tester each time does not. If you use callipers, track the sum in millimetres rather than the percentage the app gives you.
Waist and neck circumference for men, with hips added for women, in an equation developed for the US Navy. It costs nothing, takes two minutes, and its error is similar to callipers.
Because waist is the measurement that tracks visceral fat, it is also the one that matters most for health. Measure the waist at the navel, relaxed, after breathing out, first thing in the morning. Track it weekly. A falling waist with stable strength is fat loss, whatever any machine says.
No number, and the most honest method there is. Same lighting, same time of day, same three poses, every two to four weeks. Front, side and back, relaxed. Compare across months, not days.
Rough visual markers for men: a visible outline of the abdominals starts appearing around 15 percent, clear definition around 12, and veins across the lower abdomen and full separation under 10. Women carry essential fat higher, so the equivalent markers sit around 8 to 10 points above those.
Combine four cheap measures and ignore the rest:
Weight falling, waist falling and strength holding is fat loss with muscle retained. Weight stable, waist falling and strength rising is recomposition. Weight falling fast, waist barely moving and strength dropping is muscle loss, and the deficit is too large.
The FFMI calculator turns your weight, height and body fat estimate into a lean mass index that is far more useful than the fat percentage alone, and the max muscular potential calculator shows how much room is left above it, which is the number that decides whether your next block should be a bulk or a cut.
For men who train: 10 to 15 percent is lean and sustainable, 15 to 20 is healthy and comfortable, and above 25 is where metabolic risk rises. For women: 18 to 24 and 24 to 30 respectively, with risk rising above 32.
Stage condition of 4 to 6 percent in men is not a target for living at, and the hormonal cost of holding it is well documented.
The calorie and macro calculator uses body fat as one input, so a rough estimate from tape or photos is enough to set intake. It does not need a DEXA to be useful.
No method gives a true number. DEXA is the most accurate and still carries a two-point error. BIA swings with hydration and is only useful under strict, repeated conditions. Callipers and tape work with consistency. Track weekly weight, waist, photos and strength, and read the four together rather than trusting any machine.
DEXA, with an error of about one to three percentage points for an individual. Even so, changes of a single point between scans are within the noise, and hydration and glycogen affect the lean reading.
Bioimpedance devices carry an error of four to eight percentage points for an individual and swing with hydration, meals, training and sodium. They are useful only as a trend under strictly repeated conditions.
Because it is measuring water. A lower hydration level, a hard training session, less carbohydrate or more sodium the day before all change the resistance reading, which the device reports as fat.
Use the Navy tape method with waist and neck circumference, take photos in the same light every two to four weeks, and track weekly average weight and strength. Those four together are more reliable than a single scale reading.
10 to 15 percent for a lean, sustainable physique, 15 to 20 for general health. Stage condition below 6 percent is not a target for living at.
Every three to six months at most. Use the same centre each time, and test in a similar state of hydration and carbohydrate intake so the lean mass reading is comparable.
This article is educational and is not medical advice. See the medical disclaimer.
Want a programme built around your own numbers?
Work With Dinesh
Newsletter
One email when a new guide, calculator or breakdown goes live. Nothing else.